Every business owner wants to know: "How many reviews do I need to rank in Google's Local 3-Pack?" Until now, the answer has been guesswork, anecdotes, and vague advice like "more is better."
We decided to find out for real. We analyzed 50.4 million search results across 1,993 business categories to see exactly what businesses ranking in the 3-Pack actually have.
Before You Read: Key Terms to Know
What is the Google Local 3-Pack? When you search for something like "dentist near me" or "plumber in Chicago" on Google, you see a map with three businesses listed below it. That's the Local 3-Pack, the three businesses Google thinks are most relevant to your search. For local businesses, appearing in this 3-Pack is incredibly valuable. It's prime real estate that gets the most clicks and calls.
How we measure competitiveness: Throughout this report, we use three key numbers to describe review requirements:
- Entry Level (10th Percentile) - This is the minimum you need to even have a chance. Think of it as the "cover charge" to get in the door. If you have fewer reviews than this, you're unlikely to appear in the 3-Pack.
- Typical (Median) - This is what half of the businesses in the 3-Pack have. It's a good target if you want to be competitive.
- Dominant (90th Percentile) - This is what the top performers have. If you're at this level, you're ahead of 90% of your competitors in the 3-Pack.
Key Findings
Why This Matters More Than Ever: AI Is Reading Your Reviews
Here's something most business owners haven't realized yet: the same data that determines your Google 3-Pack ranking appears to be influencing AI systems that answer customer questions.
The New Reality of Search
When someone asks ChatGPT "What's the best dentist in Austin?" or Google's AI Overview summarizes local options, where does that information likely come from?
From what we've observed, AI platforms frequently surface information from Google Maps data, reviews, ratings, and Business Profiles.
What We've Seen AI Platforms Use
AI systems like Google's AI Overviews, ChatGPT, Bing Copilot, and Perplexity don't have secret shoppers visiting local businesses. Based on what we've observed in AI-generated answers, these platforms appear to draw from publicly available data sources, including Google Maps and Google Business Profiles.
When analyzing AI responses to local queries like "Who's the best plumber near me?", we've noticed patterns suggesting they consider factors such as:
- Review quantity: How many people have reviewed this business?
- Review ratings: What's the average star rating?
- Review content: What are people actually saying in their reviews?
- Review recency: Are people still talking about this business?
- Business information: Services offered, hours, location, photos
These are the same signals we analyzed in this study, suggesting that the benchmarks here may be relevant beyond just the traditional 3-Pack.
now intentionally seek out AI-powered search engines, with a majority saying it's their top source for buying decisions.
Your Reviews Are Your AI Resume
Think of your Google reviews as your business's resume for AI systems. When AI platforms generate local recommendations, businesses with stronger review profiles tend to appear more frequently in responses.
A business with:
- 215 reviews (the median for plumbers)
- 4.8 star rating
- Recent reviews mentioning specific services
- Detailed business information
...appears more likely to surface in AI-generated answers than a competitor with 30 reviews from two years ago, based on the patterns we've observed.
This Is Only Going to Accelerate
We're in the early stages of AI-powered search. Google is rolling out AI Overviews to more queries. ChatGPT and other AI assistants are becoming the first place people go for recommendations. Voice assistants are answering local queries.
From what we've seen, these systems frequently reference publicly available business data, including Google Business Profiles and reviews.
The businesses investing in their review presence today aren't just competing for the 3-Pack. They're positioning themselves for visibility as AI-powered discovery continues to grow.
What This Means for Your Strategy
The benchmarks in this report aren't just about ranking in the traditional 3-Pack anymore. They're about:
- Getting mentioned by AI: Businesses with strong review profiles are more likely to be recommended when AI answers local queries
- Shaping what AI says about you: The content of your reviews influences how AI describes your business
- Future-proofing your visibility: As more search shifts to AI, your Google data becomes even more critical
What Does It Actually Take to Rank?
Forget the edge cases and outliers. What really matters is the median, the number of reviews that half of the businesses ranking in the 3-Pack have. This is your real target: the benchmark that separates competitive businesses from those still building their reputation.
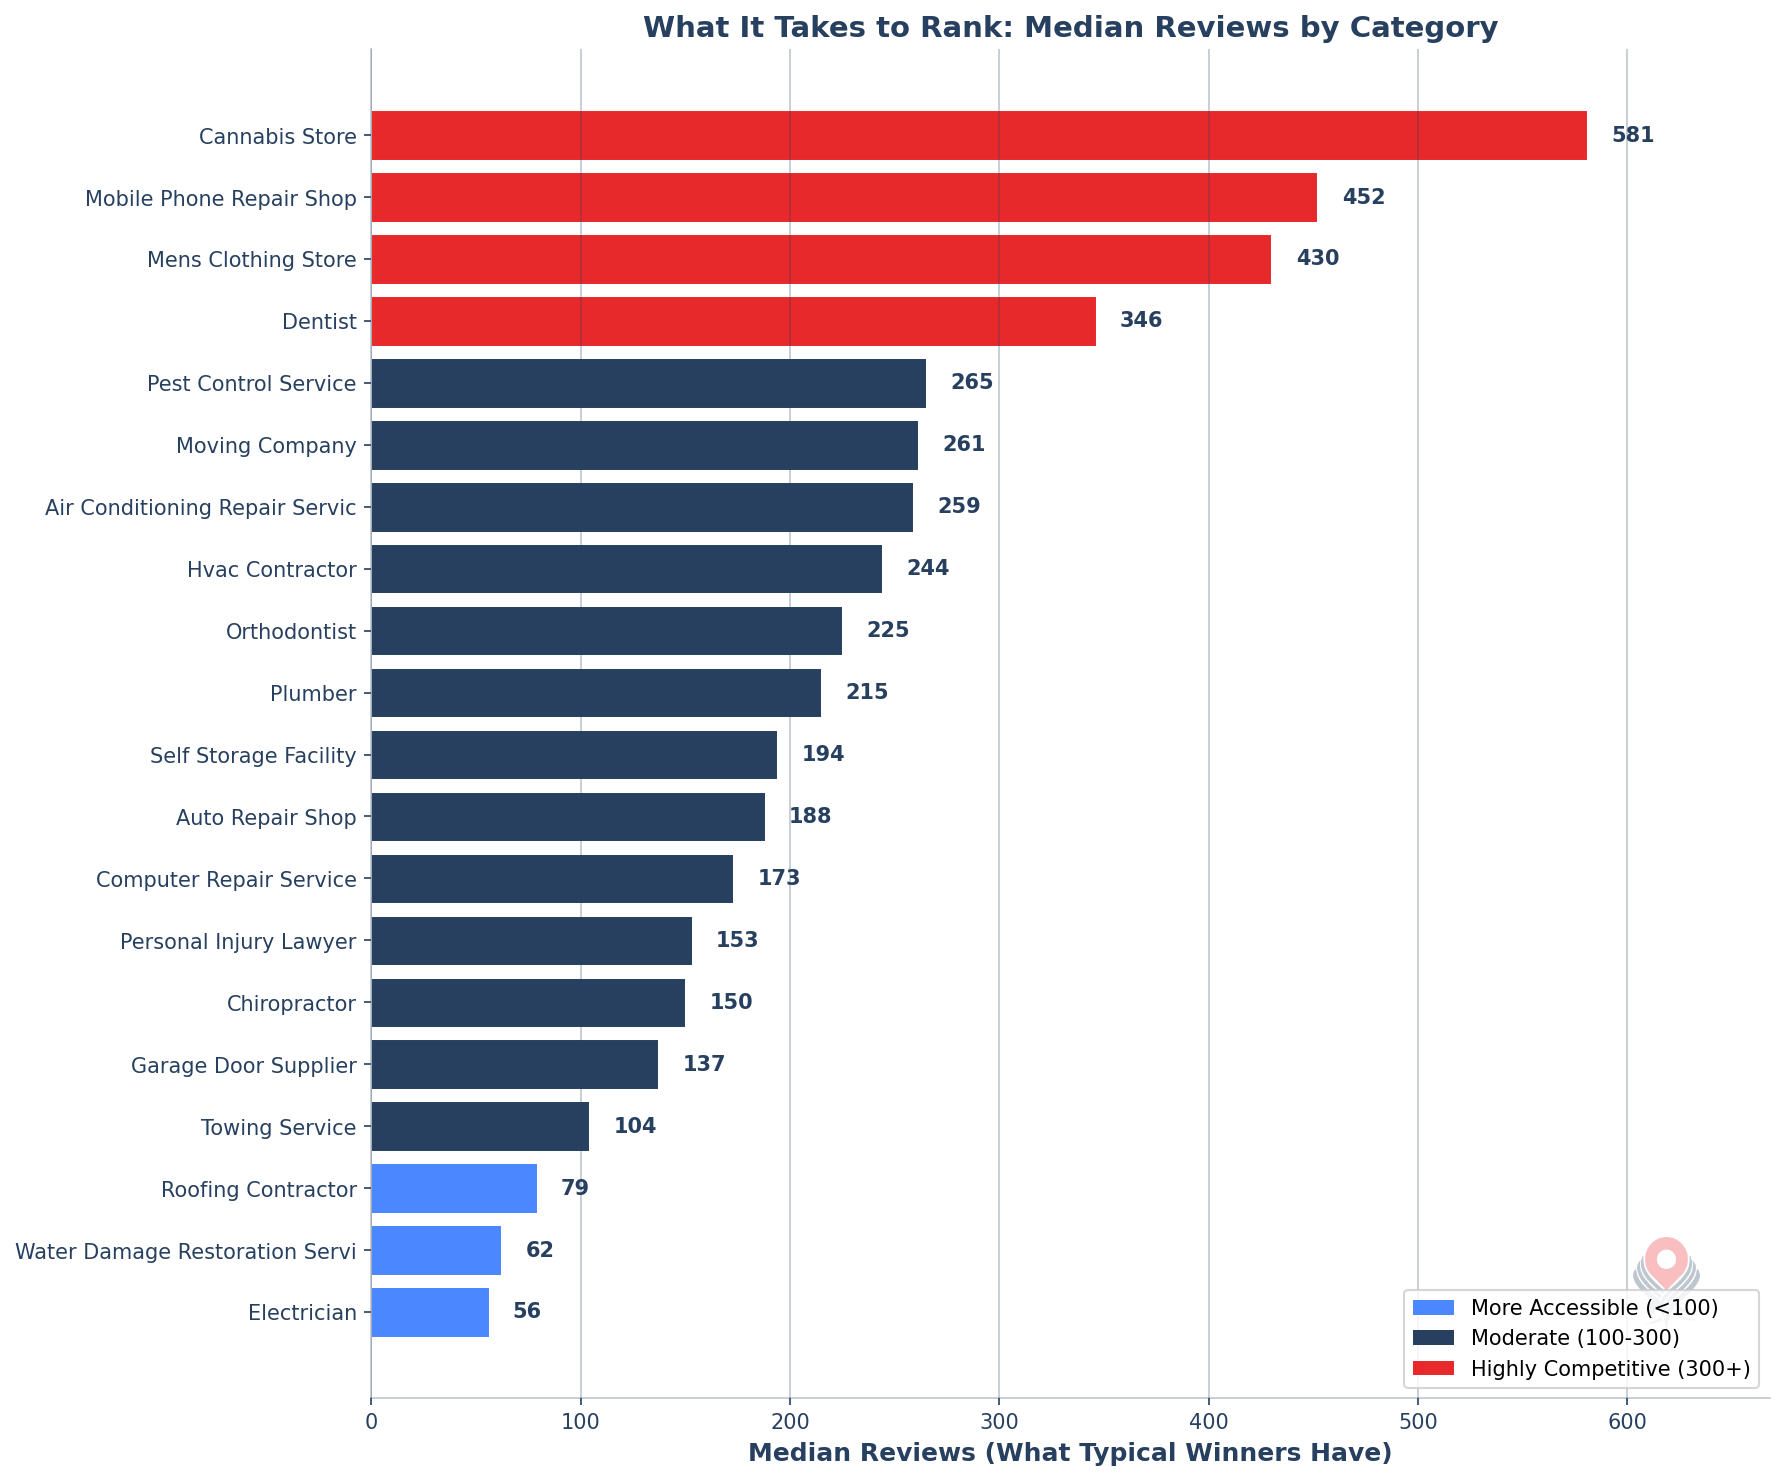
The median reviews for businesses ranking in the 3-Pack. This is what typical winners have across industries, and it's your real target to be competitive.
Want to see the data for your specific business category?
Find Your Category BenchmarksSearch 1,993 categories to find yours.
The numbers vary dramatically by industry. Some categories are surprisingly accessible, while others require a serious review-building strategy.
More Accessible (Under 100 reviews)
- Home Health Care: 20 reviews
- General Contractor: 28 reviews
- Tree Service: 47 reviews
- Electrician: 56 reviews
- Painter: 58 reviews
- Roofing Contractor: 79 reviews
Moderate Competition (100-300 reviews)
- Chiropractor: 150 reviews
- Personal Injury Lawyer: 153 reviews
- Locksmith: 166 reviews
- Auto Repair Shop: 188 reviews
- Self Storage: 194 reviews
- Plumber: 215 reviews
Highly Competitive (300+ reviews)
- Dentist: 346 reviews
- Tire Shop: 413 reviews
- Phone Repair Shop: 452 reviews
- Oil Change Service: 512 reviews
- Cannabis Store: 581 reviews
- Breakfast Restaurant: 976 reviews
Why Such Big Differences?
Industries with high transaction volumes (think restaurants, retailers) naturally accumulate more reviews. A breakfast spot might serve 200 customers a day, while a plumber might complete 5 jobs. This creates vastly different review landscapes and different competitive requirements.
The Full Picture: Entry, Typical, and Dominant
The median shows you what typical winners have. But to fully understand your competitive landscape, you also need to see what it takes to truly dominate your market: the 90th percentile where the top performers sit.
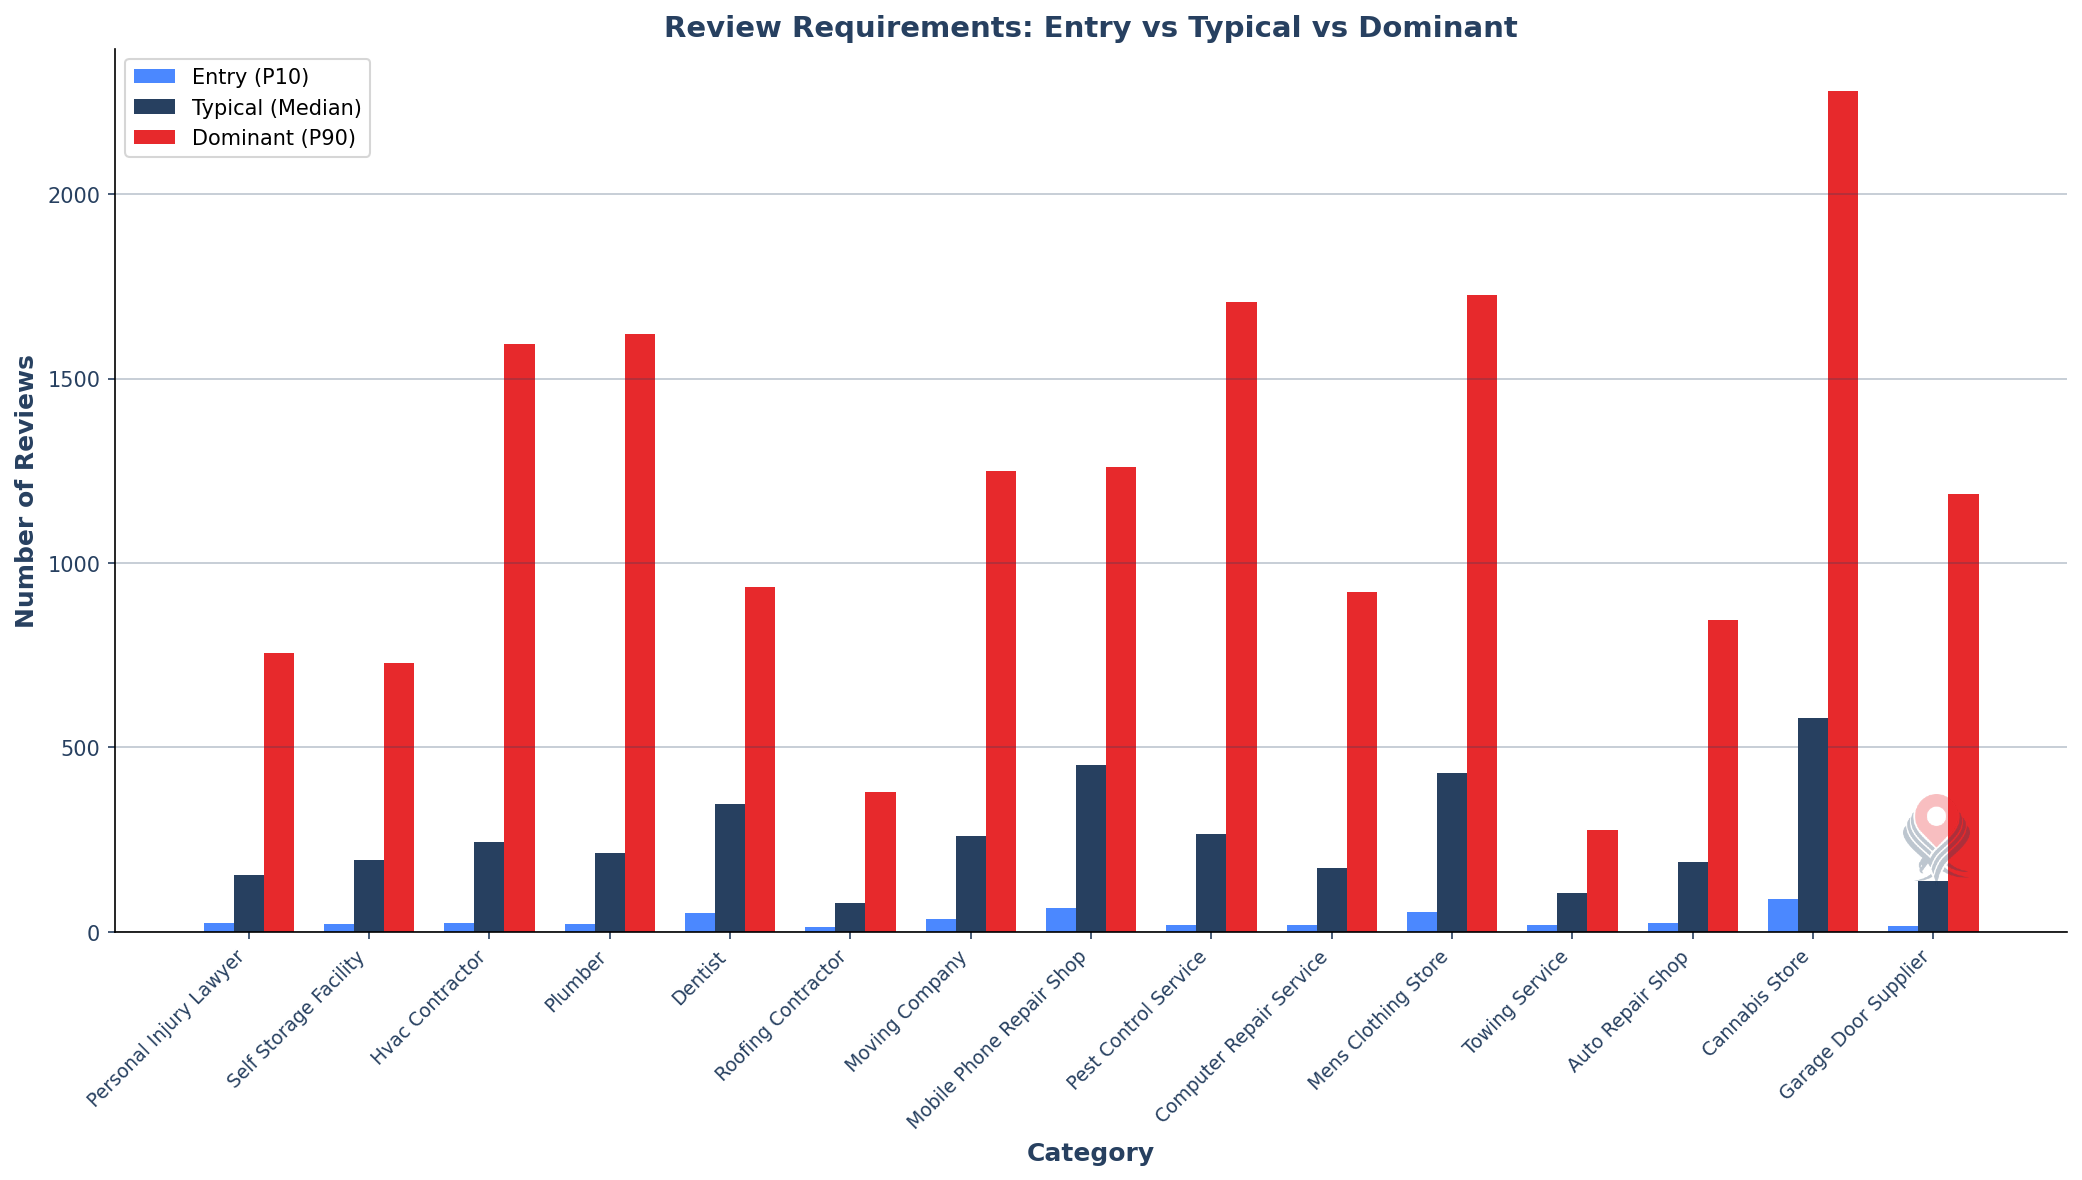
The light blue bar shows entry level (P10), blue shows typical (median), and red shows dominant (P90). Notice how the gap between entry and dominant can be 30-80x in some categories.
Want to see the data for your specific business category?
Find Your Category BenchmarksSearch 1,993 categories to find yours
What Do These Numbers Mean for You?
If you're a new business: Focus on reaching the entry level first. That's your immediate goal.
If you're already in the 3-Pack sometimes: Aim for the median (typical) level to be consistently competitive.
If you want to dominate your market: The P90 numbers show what the top players have. It's a long-term goal, but it's achievable with consistent effort over time.
Top 20 Categories by Data Volume
These are the categories with the most search data, giving us the highest confidence in these numbers:
| Category | Entry (P10) | Typical (Median) | Dominant (P90) |
|---|---|---|---|
| Personal Injury Lawyer | 25 | 153 | 756 |
| Self Storage Facility | 20 | 194 | 728 |
| HVAC Contractor | 25 | 244 | 1,594 |
| Plumber | 21 | 215 | 1,621 |
| Dentist | 52 | 346 | 935 |
| Roofing Contractor | 13 | 79 | 378 |
| Moving Company | 36 | 261 | 1,249 |
| Phone Repair Shop | 64 | 452 | 1,261 |
| Pest Control Service | 18 | 265 | 1,708 |
| Computer Repair Service | 18 | 173 | 922 |
| Men's Clothing Store | 54 | 430 | 1,726 |
| Towing Service | 19 | 104 | 275 |
| Auto Repair Shop | 23 | 188 | 846 |
| Cannabis Store | 89 | 581 | 2,280 |
| Garage Door Supplier | 17 | 137 | 1,187 |
| Water Damage Restoration | 11 | 62 | 284 |
| Electrician | 4 | 56 | 661 |
| Chiropractor | 23 | 150 | 527 |
| AC Repair Service | 25 | 259 | 1,693 |
| Orthodontist | 37 | 225 | 755 |
The Most Competitive Categories
These categories have the highest review requirements. If you're in one of these industries, be prepared for stiff competition:
| Category | Entry (P10) | Typical (Median) | Dominant (P90) |
|---|---|---|---|
| Breakfast Restaurant | 227 | 976 | 2,768 |
| Cannabis Store | 89 | 581 | 2,280 |
| Oil Change Service | 127 | 512 | 1,374 |
| Phone Repair Shop | 64 | 452 | 1,261 |
| Restaurant | 77 | 451 | 1,951 |
| Men's Clothing Store | 54 | 430 | 1,726 |
| Tire Shop | 78 | 413 | 1,128 |
| Cosmetic Dentist | 98 | 369 | 1,014 |
| Pediatric Dentist | 82 | 360 | 1,015 |
| Dentist | 52 | 346 | 935 |
The Least Competitive Categories
Good news if you're in one of these industries; you can compete with far fewer reviews:
| Category | Entry (P10) | Typical (Median) | Dominant (P90) |
|---|---|---|---|
| Storage Facility | 1 | 17 | 244 |
| Home Health Care | 2 | 20 | 79 |
| Construction Company | 2 | 20 | 90 |
| Mental Health Service | 2 | 20 | 143 |
| Marketing Agency | 1 | 21 | 108 |
| Concrete Contractor | 2 | 25 | 293 |
| Counselor | 2 | 26 | 147 |
| General Contractor | 3 | 28 | 118 |
| Insurance Agency | 2 | 34 | 317 |
| Lawn Care Service | 3 | 36 | 374 |
What About Star Ratings?
Reviews aren't just about quantity; quality matters too. We analyzed star ratings to understand what rating you need to compete, and found that 4.5-4.7 stars is the minimum rating needed to compete in most categories.
Why Ratings Are More Uniform Than Review Counts
Review counts depend heavily on transaction volume. A restaurant gets more chances to collect reviews than a roofer. But customer expectations for quality are similar across industries. People expect good service whether they're getting their teeth cleaned or their AC fixed, so rating requirements cluster tightly around 4.5-4.9 stars everywhere.
Rating Requirements by Category
| Category | Minimum (P10) | Typical (Median) |
|---|---|---|
| Personal Injury Lawyer | 4.7 | 4.9 |
| Self Storage Facility | 4.3 | 4.8 |
| HVAC Contractor | 4.6 | 4.9 |
| Plumber | 4.5 | 4.8 |
| Dentist | 4.4 | 4.9 |
| Roofing Contractor | 4.6 | 4.9 |
| Moving Company | 4.5 | 4.9 |
| Pest Control Service | 4.6 | 4.9 |
| Chiropractor | 4.8 | 4.9 |
| Towing Service | 3.1 | 4.3 |
The Towing Exception
Towing services are a notable outlier. Even towing businesses with 3.1 stars can appear in the 3-Pack. This reflects the split nature of towing customers: half are grateful (roadside assistance, breakdowns) while half are upset (parking violations, repossessions). This inherent 50/50 split drives down ratings industry-wide, so Google's algorithm adjusts accordingly.
Does Location Matter?
We hear this question constantly: "Is it harder to rank in a big city?" The answer is yes, but maybe not as much as you'd think.
How We Classified Locations
We grouped every search result by the population density of its zip code:
- Rural: Less than 500 people per square mile (think small towns)
- Suburban: 500-3,000 people per square mile (typical suburbs)
- Urban: 3,000-10,000 people per square mile (smaller cities, dense suburbs)
- Metro: More than 10,000 people per square mile (major city centers)
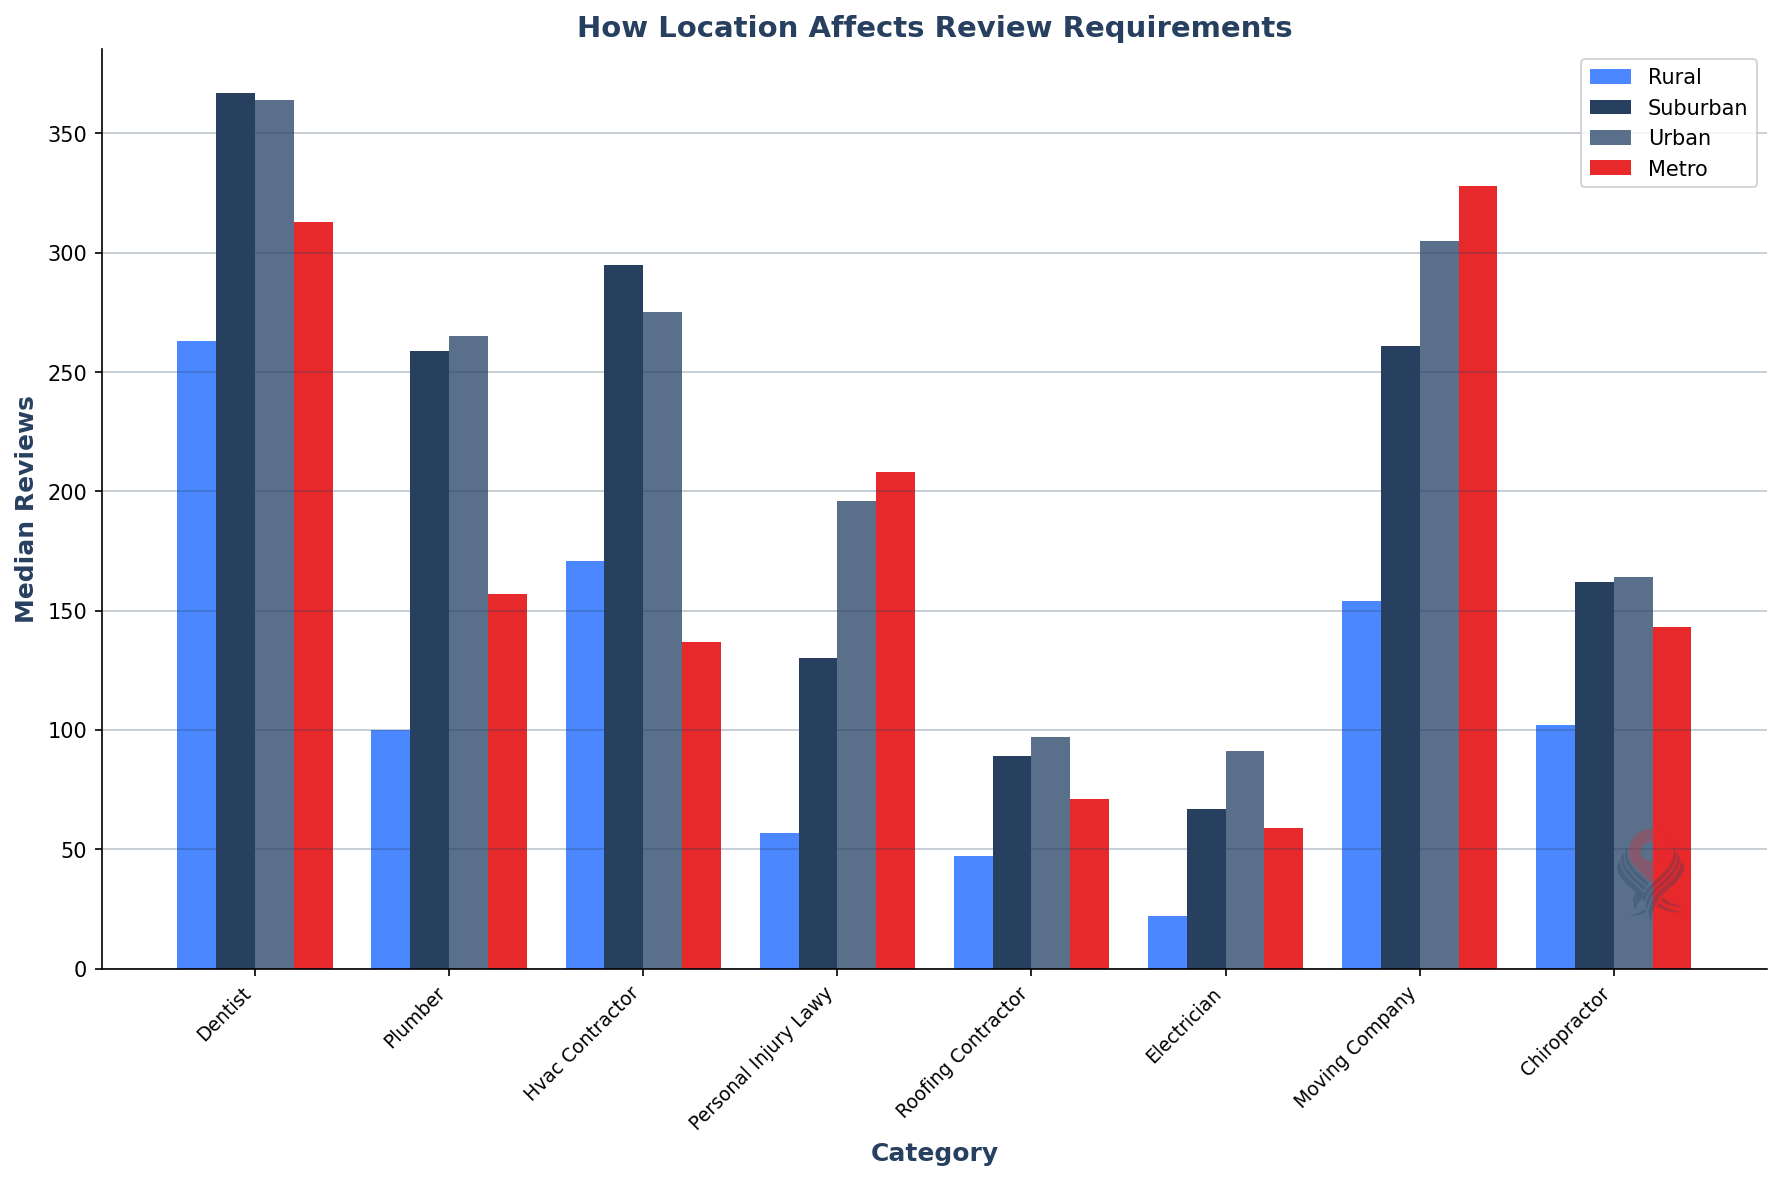
Median review requirements by category and location density. Notice how the pattern is consistent: more density = more reviews needed.
The Location Factor
On average, metro areas require roughly 1.5-2x as many reviews as rural areas, though this varies significantly by category. Some categories show almost no difference, while others can be 3x or more. So if a rural plumber needs 100 reviews to be competitive, a plumber in downtown Chicago might need 150-200.
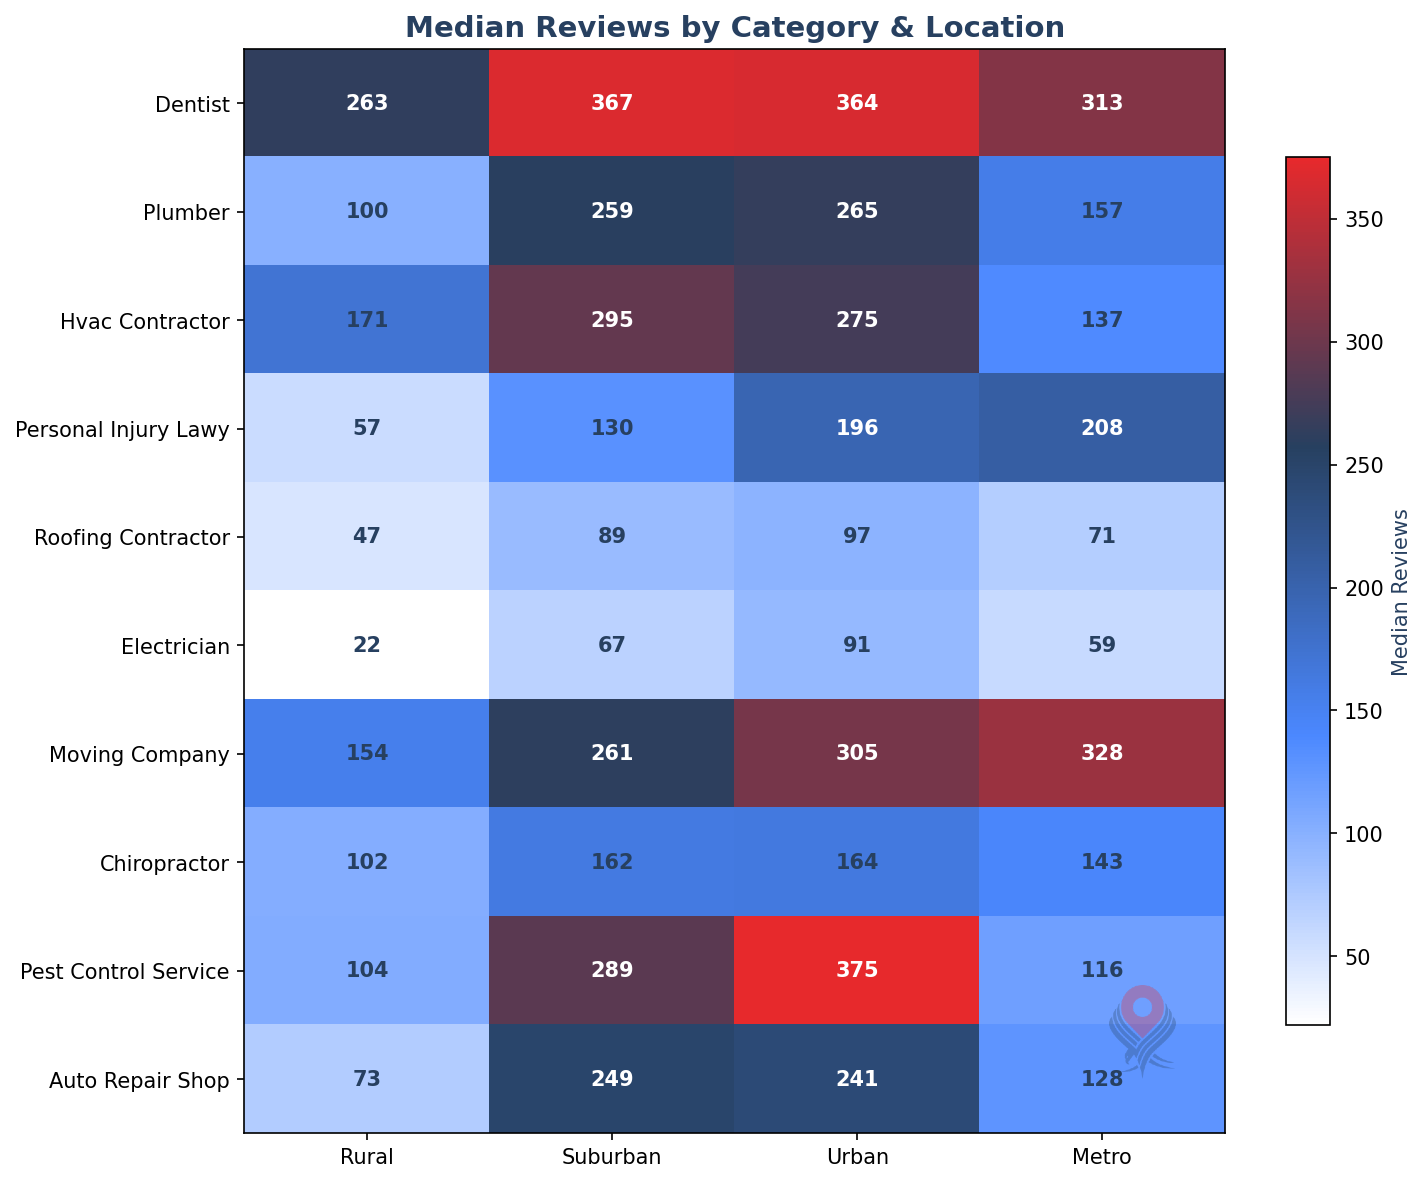
Heatmap showing median reviews required. Darker red = more reviews needed. You can see the urban/metro columns are consistently darker (higher) than rural.
Want to see the data for your specific business category?
Find Your Category BenchmarksSearch 1,993 categories to find yours.
Real Examples: How Location Changes the Game
HVAC Contractor
| Location Type | Entry (P10) | Typical (Median) | Dominant (P90) |
|---|---|---|---|
| Rural | 14 | 132 | 920 |
| Suburban | 26 | 255 | 1,651 |
| Urban | 32 | 305 | 2,007 |
| Metro | 45 | 361 | 1,817 |
Dentist
| Location Type | Entry (P10) | Typical (Median) | Dominant (P90) |
|---|---|---|---|
| Rural | 27 | 180 | 544 |
| Suburban | 56 | 366 | 955 |
| Urban | 67 | 407 | 1,022 |
| Metro | 80 | 462 | 1,063 |
What Should You Do With This Information?
If You're Just Starting Out
Your first goal is simple: reach the entry threshold for your category. Look up your industry in our tables and focus on getting to that P10 number. Every review counts more when you're starting from zero.
Quick Wins for New Businesses
- Ask every happy customer. Many will leave a review if you simply ask at the right moment - right after a successful service or purchase.
- Make it easy. Send a direct link to your Google review page. Every extra click loses potential reviewers.
- Respond to every review. It shows you care and encourages others to leave reviews too.
If You're Already Competitive
Once you've reached the entry threshold and you're appearing in the 3-Pack sometimes, your goal shifts to consistency. Aim for the median (typical) level to be a regular presence in search results.
If You Want to Dominate
The gap between "competitive" and "dominant" is significant. Here's what it looks like:
| Category | Entry (P10) | Dominant (P90) | Gap |
|---|---|---|---|
| Electrician | 4 | 661 | 165x |
| Pest Control | 18 | 1,708 | 95x |
| Plumber | 21 | 1,621 | 77x |
| HVAC Contractor | 25 | 1,594 | 64x |
| Dentist | 52 | 935 | 18x |
Domination doesn't happen overnight. These numbers represent years of consistent review generation. But they show what's possible with sustained effort.
Rating Strategy
- Minimum viable: 4.3-4.5 stars gets you in the door
- Competitive: 4.7-4.8 stars is where most 3-Pack winners sit
- Optimal: 4.9+ is great, but returns diminish above 4.8
- Recovery is hard: If you're below 4.0 stars, focus on service quality before worrying about review quantity
The Factor We Didn't Measure: Review Recency
This study focused on review quantity, ratings, and location type, but there's another factor that matters for local rankings: how recent your reviews are.
We chose not to duplicate that research because our friends at Sterling Sky have already done an excellent job studying recency.
Research from Sterling Sky
Joy Hawkins and the Sterling Sky team studied the relationship between review recency and local rankings. Their key findings:
- Fresh reviews signal trust: Recent, timestamped reviews appear to function as a trust signal to Google's algorithm.
- Stopping hurts: Businesses that stopped collecting reviews (even with strong historical ratings) saw ranking declines.
- Velocity matters: The "right" frequency depends on your competitors. Highly competitive markets may need weekly reviews; smaller markets might succeed with monthly.
What This Means for You
Use our data to set your target; how many reviews you need to be competitive in your category. But don't stop once you hit that number. Build a sustainable system for generating reviews consistently:
- Ask every satisfied customer for a review
- Make it easy with a direct link to your Google review page
- Train your team to incorporate review requests into their workflow
- Monitor your review velocity relative to competitors
For a deeper dive into review recency and local SEO, we highly recommend Sterling Sky's full research.
How We Did This Research
Transparency matters. Here's exactly how we conducted this analysis so you can understand (and trust) the numbers.
1. Data Collection
We started with 70.7 million scan point records from Local Falcon's database covering Q4 2025 (October through December). Each record represents a business appearing in Google's Local 3-Pack for a specific keyword at a specific location.
2. Removing Duplicates
Here's a problem with raw scan data: if one user scans "plumber in Chicago" 1,000 times, that would massively skew results toward whatever businesses rank there. To fix this, we de-duplicated on unique lat/lng. We rounded coordinates to about 110 meters of precision and kept only one result per unique (location + keyword) combination. This ensures every unique search context counts exactly once, regardless of how many times it was scanned.
3. US Filtering
We filtered to US addresses only by parsing state and zip codes from business addresses. This gave us 50.4 million records, still a massive dataset, but focused on the US market.
4. Location Classification
We classified each zip code by population density using Census data. This lets us compare rural, suburban, urban, and metro markets.
5. Statistical Analysis
We calculated percentiles (P10, P25, median, P75, P90) for reviews and ratings, grouped by category, location type, and keyword. We only included groups with at least 100 data points to ensure statistical reliability.
Limitations to Keep in Mind
- Correlation, not causation: This data shows what businesses in the 3-Pack have. It doesn't prove that reviews alone caused them to rank. Google's algorithm considers many factors.
- Point in time: These benchmarks reflect Q4 2025. Competitive landscapes change over time.
- Geographic coverage: The data reflects where Local Falcon users scan, which may over-represent certain regions or business types.
- New businesses face extra hurdles: Beyond reviews, new businesses also contend with factors like business age, brand consistency, etc.
Data Summary
Here's a quick summary of the scale of this research:
| What We Analyzed | Count |
|---|---|
| Total search results analyzed | 70,733,561 |
| US results (after filtering) | 50,357,778 |
| Unique business profiles | 2,779,825 |
| Business categories with enough data | 1,993 |
| Keywords with enough data | 67,568 |
| Category + Location combinations | 5,367 |