Local Falcon Trend Reports are generated automatically when you run multiple scans for the same location and keyword, compiling the data from these scans to show you performance trends over time.
As long as Falcon AI was enabled for at least one of the scans used to generate a Trend Report, you'll also find a handy AI analysis section in the report, making it easier than ever to understand trends and pinpoint changes in the local market or optimizations that affected your ranking.
Looking at the Ranking Scores and Trend Graphs
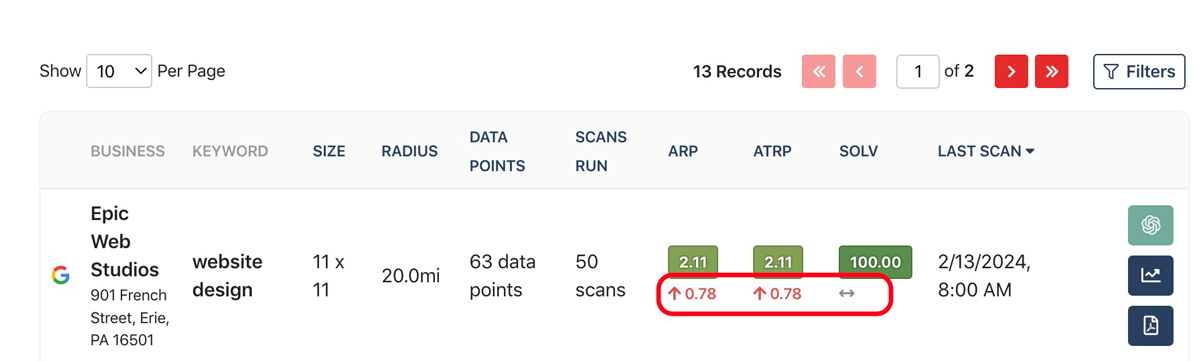
At the top of any Trend Report you'll see some familiar looking data that's found in all your reports, including your Average Rank Position (ARP), Average Total Rank Position (ATRP), and Share of Local Voice (SoLV) scores, as well as information about the Scan Settings used (location, keyword, Map Scan Radius and Grid Size, etc.).
Below this top-level data there are several buttons, which allow you to jump ahead to the AI analysis, refresh the report, and download or share the report. Hovering your mouse over each button will display its respective function.
Next, you'll see an interactive graph, which lets you easily visualize trends in your local ranking performance over time. Here you can choose between line and bar graph, depending on how you prefer to see the data, and click back and forth between ARP, ATRP, and SoLV to see the trends at a glance.
Checking the Trend Report AI Analysis
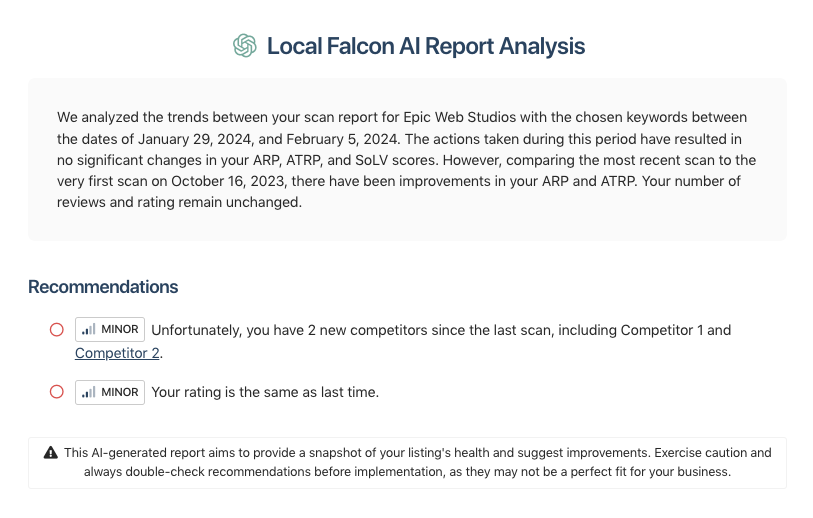
Once you've looked at the data yourself, scroll down past the graph to find the "Local Falcon AI Report Analysis" section, which takes care of the trend analysis for you by summing up all the changes in an easy-to-digest overview.
After the Falcon AI overview, you'll find a list of "Recommendations," which highlights performance issues and suggests ways to optimize your listing to fix them and improve your ranking before the next scan.
For example, the AI might tell you that there are more competitors in the local market since the last scan, which may have caused your ranking to drop. The AI might then suggest that you focus on getting more reviews and improving your average review score to try and boost your scores again.
But Falcon AI doesn't just focus on the bad — there's also an "Already Completed" section at the end of the Trend Report AI analysis that spotlights positive changes and optimizations that you've completed. For instance, it might congratulate you on adding social media links to your business listing and increasing your SoLV score since the last scan.
All of this AI analysis is perfect for saving you time when it comes to reporting on local SEO efforts to stakeholders, making it easy to not only showcase the trends, but also pinpoint potential reasons behind the trends, such as shifts in the competition or optimizations you've implemented.
Comparing Competitor Scan Results
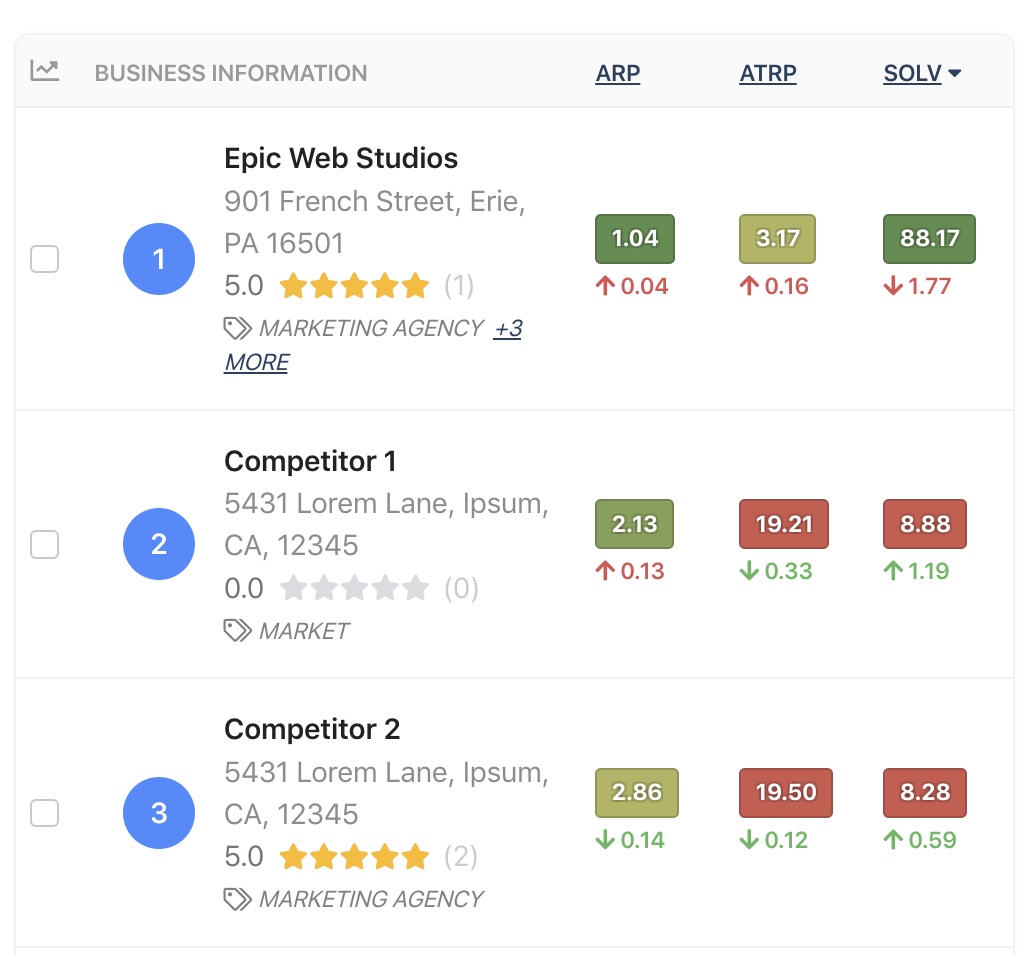
At the end of the Trend Report you'll find a section where you can compare individual scan results for all locations found in each scan used to generate the report. This can be useful if you want to quickly check competitor results and compare them to yours for a particular scan.
For instance, you might know that your SoLV score dropped since the last scan, so you could go and see which of the competitors above you in the rankings increased their SoLV scores and try to identify what may have caused the shift in scores, such as a change in total number of reviews or average review score.
To the right of the list of locations found in the scan there's also a GIF that shows what the Scan Grid looked like for your location in each scan used in the trend report. You can even download this GIF to use in reporting to easily show how the Scan Grid has changed over time.
This section also contains direct links to the Scan Reports and Competitor Reports for every scan used in the Trend Report, so you can navigate to either of those if you want to look more closely at your individual scan results or compare competitors more in depth for a particular scan.
Using the Competitor List with the Trend Graph
You might notice that each location in the competitor list has a checkbox next to it. You can select one or more competitors to compare trends by checking or unchecking these boxes. The trend graph above will automatically update to display a line or bar for each competitor you've selected, giving you a quick visualization of how competitors' trends compare to yours.
Categories:Local Falcon AIReporting
Tags:trend reportreporting