Local Falcon Competitor Reports provide an overview of the performance and ranking of every competitor that appeared in a scan.
Competitor Reports show a list of key performance data and ranking factors for each location, including ARP, ATRP, and SoLV scores, as well as number of reviews, average review score, and categories. Clicking on a location in the list will show you exactly how the business ranks at different points on the geo-grid.
Analyzing Competitor Rankings
When you open up a Competitor Report, you'll see a scrollable list of all competitors that appeared in the scan. The location you scanned for will also appear in this list, but only if it actually ranked in the scan.
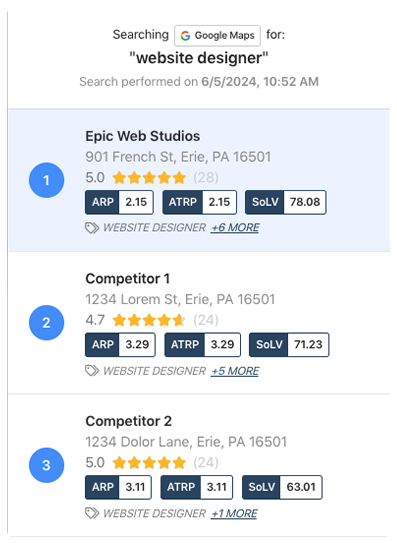
Scroll down the list to find your business and compare its performance data, especially the SoLV, or Share of Local Voice, score, to close competitors to help you identify potential opportunities to outrank them.
For example, let's say your business is in 3rd place with a SoLV score of 18.37, and the competitor immediately above you in 2nd place has a SoLV score of 20.41.
This would show you that there's an opportunity to jump up in the rankings if you can increase your SoLV score by just a couple of points.
Now, you can compare the other performance data and ranking factors for your location and the competitor to see what's different that might be causing them to appear more often in the top 3 search results.
You might see that they have a slightly higher average review score, for instance, so you could focus on improving the customer experience at your location and getting more positive reviews to try and outrank the competitor.
Keep in mind that, if you haven't already, the best way to start optimizing your listing is by checking the scan's Scan Report first and implementing optimization recommendations provided by Falcon AI's analysis.
Even if your business doesn't appear in the rankings for a particular scan, you can still analyze competitor rankings and look for ways you might optimize your listing to start ranking for a particular keyword. For example, you can check the categories selected by top competitors found in the scan to see if there might be a relevant category that you could add to your listing.
Comparing Scan Grids
While you're analyzing competitor rankings in the Competitor Report, click on any location to see how the Scan Grid looks for that particular competitor.
Note that the location you ran the scan for will be the center Grid Point by default, and any competitor's location will be marked on the map with a building icon.
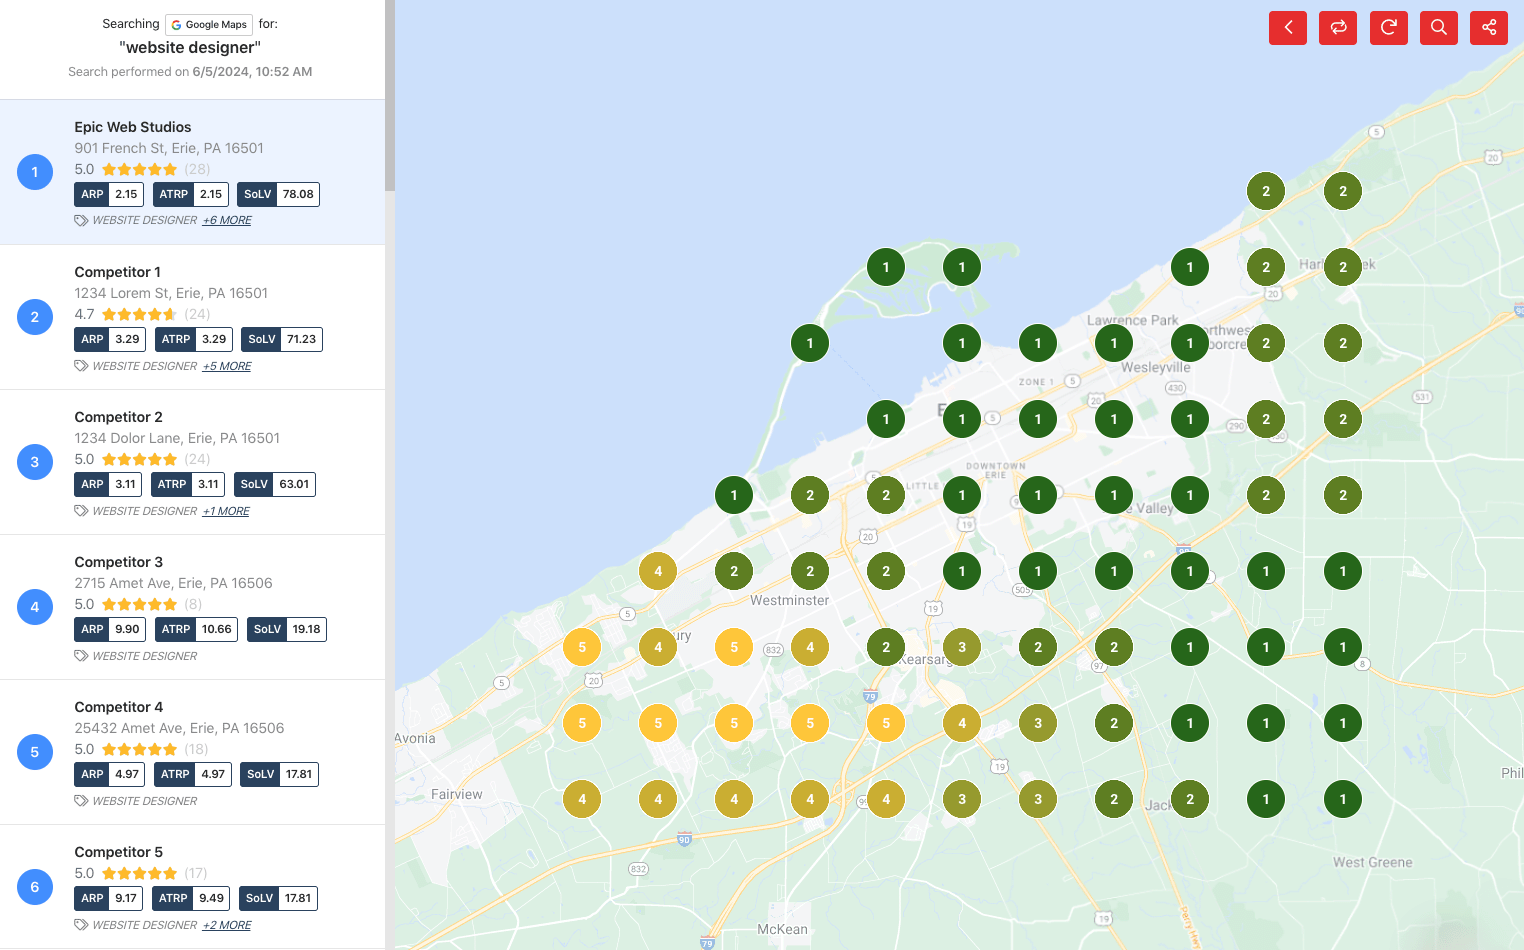
Comparing what the Scan Grid looks like for competitors to what it looks like for your location can give you an idea of where you're doing best in the rankings geographically, as well as what Grid Points you might be able to outrank competitors at if you optimize your listing.
For example, if you compare the Scan Grid for your business and the competitor directly above you, you'll probably see that you're both ranking in the top 3 positions at the Grid Points closest to your respective locations, and that rankings decrease moving outward from each location.
You might notice that there's a Grid Point somewhere in the middle between your locations where your competitor is ranking 3rd and you're ranking 5th.
As you optimize your listing, you could continue to compare your rankings at this Grid Point over time to see if optimizations allow you to rank higher at this point, using it as a measure of your success in outranking your competitor at a hyper-local level.
Comparing Competitors Side by Side
If you hover over any business in the competitor list, you'll see a red button with two inward-facing arrows appear. When you hover your mouse over the button it will say "Compare Locations."
Clicking on this button launches a pop-up that lets you compare the business side by side with any other competitor in the report. Just select any of the businesses from the drop-down list in the pop-up that appears, then click "Compare Businesses."
You'll now see a side-by-side comparison of key business info and ranking data for the two businesses.
Layering Business Locations and Using Proximity Insights
One of the most powerful features of the Competitor Report is the ability to layer all business locations over the Scan Grid, which you can do with the view selection buttons. This allows you to see exactly where competitors' physical locations are concentrated in your target market or service area.
-
Identify high-density competitor areas: If an area of your ranking geo-grid shows mostly red pins and many competitor locations are clustered there, it may be very difficult to improve your SEO visibility due to proximity dominance. These areas are often better addressed with paid advertising, such as Google Ads, Maps Search Ads, or Local Services Ads, rather than trying to compete organically.
-
Optimize where it matters: Focus your SEO efforts on areas where you already have moderate visibility (yellow or orange pins) or where competition is lower. This ensures your time and resources are spent on opportunities where you can realistically move the needle.
-
Other uses for location layering:
-
Spot underserved areas with few competitors where organic SEO or ads could yield high impact.
-
Plan localized campaigns, events, or promotions in regions where competitor density is low.
-
Benchmark competitor reach and identify markets they may be neglecting.
-
By combining Competitor Report ranking insights with physical business location layering, you can make data-driven decisions about where to focus organic SEO efforts, where to consider investing in ads, and which areas might be secondary priorities for local SEO. This approach helps maximize both visibility and budget efficiency across your local market.
Category:Reporting
Tags:competitor reportreporting