Local Falcon Scan Reports give you a birds-eye view of where your business ranks in local search results for any given keyword within the area specified by setting the Map Scan Radius and Grid Size.
Scan Reports provide you with a range of top-level local ranking data as well as a detailed AI analysis of your competitors and listing health, complete with actionable optimization recommendations that you can implement right away.
Understanding the Scan Report Data
At the very top of any Scan Report, you'll see information about the scan itself, including the Scan Settings you used and key business info (business name, address, and overall review score/number of reviews).
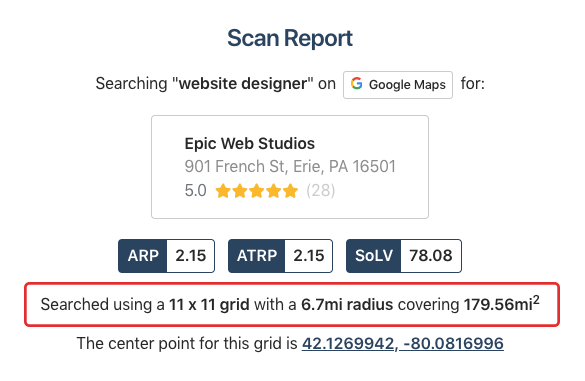
Note that your past Scan Reports will display business information captured at the time of the scan. In other words, if the business name, address, or reviews have changed, you'll see the old information when you open up a past Scan Report (unless the scan was performed before July 26, 2024 — Scan Reports from before then automatically show current business info).
Scan Report Metrics
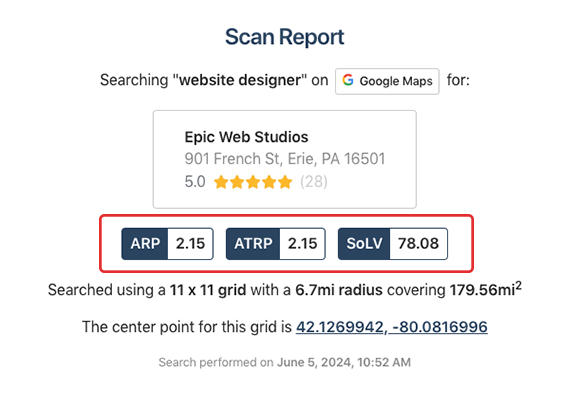
Along with all of this info, you'll also see three different scores: ARP, ATRP, and SoLV — these are what you should make sure you understand in order to start analyzing your local ranking and identifying opportunities to improve it.
ARP and ATRP
ARP and ATRP stand for Average Rank Position and Average Total Rank Position. The ARP shows how your location ranks in relation to the top 20 listings in the area scanned, while the ATRP shows how it ranks among all listings found.
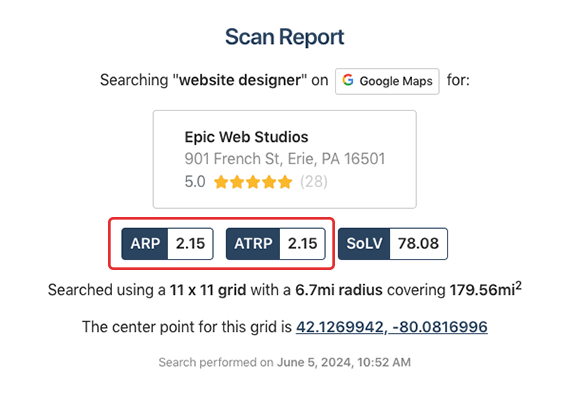
For example, if your ARP score is 17.38, it means that your business typically shows up around the 17th spot among the top 20 listings, which are usually those closest to the center point of the scanned area. And, if your ATRP score is 18, it means that your listing typically shows up around the 18th spot among all listings in the area scanned.
Keep in mind that the smaller the area you scan is, the closer these scores will tend to be, as there will be more overlap between the top 20 listings and all the listings found in the area.
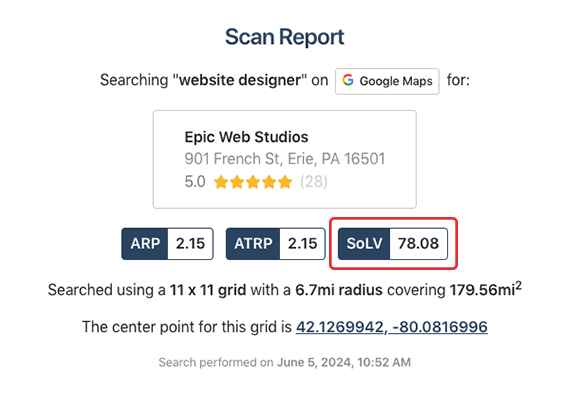
Share of Local Voice (SoLV)
SoLV stands for Share of Local Voice. Your SoLV score indicates how often you show up in the top 3 positions in local search results for that scan.
The top 3 positions in local search results get nearly half of all clicks, making SoLV one of the most important stats a business should monitor.
The SoLV score is out of 100 and represents the total possible times your business could show up in the top 3 positions.
So, if your SoLV score is 18.37, it means your listing shows up in the top 3 results 18.37% of the time for the area scanned.
A Scan Report showing 100 SoLV is the best case scenario, but not always attainable due to competition.
An easy way to track your ranking in your local area is to automate your scans using Campaigns and focus on SoLV movement over time. If your SoLV goes up, that can indicate that you started showing up in the top 3 in an area. If your SoLV goes down, that can indicate that competition has pushed you out of the top 3 in an area.
Scan Report Metric Insights
In addition to ARP, ATRP, and SoLV, Scan Reports also include several advanced metric insights designed to help you understand how competitive your location is across the scanned area. These insights make it easier to compare performance against nearby competitors and identify opportunities to expand your visibility.
SoLV Distance
SoLV Distance shows how far away from your business you rank in the top 3, compared to how far competing businesses rank in the top 3 from their own locations.
This metric helps you understand whether your top-ranking visibility is spread across a wide geographic area or concentrated very close to your location.
-
Your Distance: The average distance from your business to all grid points where you appear in the top 3.
-
Average Distance: The average distance from each competitor's location to the grid points where they appear in the top 3. This value is averaged across all competitors in the scan.
-
Goal: Match or exceed the Average Distance. A higher (or equal) distance means your top 3 coverage area is as large as (or larger than) your competitors'.
A higher SoLV Distance generally indicates stronger geographic reach and greater local authority.
OSoLV (Opportunity Share of Local Voice)
OSoLV highlights your potential to become the market leader by comparing your SoLV directly to the top-performing competitor in the scan.
-
Your SoLV: The percentage of grid points where your business ranks in the top 3.
-
Top SoLV: The highest SoLV score achieved by any competitor found in the scan.
-
Goal: Reduce or eliminate the gap between your SoLV and the Top SoLV.
This metric insight helps you quickly assess how close you are to overtaking the leading competitor and where strategic improvements could meaningfully increase your market share.
Competitors
The Competitors metric insight breaks down the difference between all businesses detected in the scan area and the ones that actually matter for ranking purposes.
-
Total Competitors: All unique business listings found anywhere in the scan results.
-
Active Competitors (with SoLV > 0): Only the competitors that appear in the top 3 at least once. These are the listings that directly compete with you for high-visibility positions.
-
Purpose: To distinguish between the full competitive landscape and the smaller set of businesses that truly impact your ranking opportunities.
Focusing on Active Competitors helps you understand which businesses are actually winning top placements in local search results and where competitive pressure is strongest across the geo-grid.
The Scan Explorer
Below the Map Scan info and your ARP, ATRP, and SoLV scores, you'll see the Scan Explorer, which is an interactive map showing the area scanned and all the individual Grid Points, or data points scanned, within it.
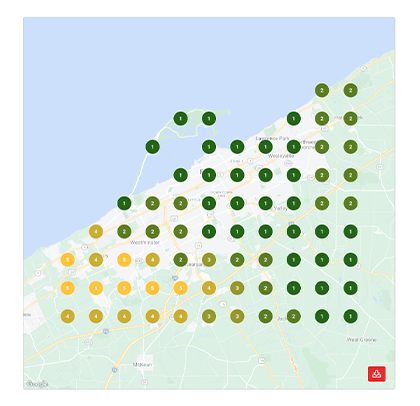
The numbers on the Grid Points show the rank for your listing within local search results for searches performed at that specific Grid Point.
For instance, if a Grid Point has a value of 1, this means that your business was in the number 1 spot for searches done at that point on the map. On the other hand, a Grid Point with a value of 20+ indicates that your listing isn't showing up there at all (or it's so far down in the rankings that it might as well not be).
These Grid Points are also color-coded according to how you rank at each location, with Green points representing a top position, yellow and orange points representing a middle position, and red points representing a very low (or non-existent) position. Points are shaded darker or lighter according to their rank, giving you a more detailed visual overview.
In some cases, you might see a map pin marked with "KP." This indicates that there is only one result found at that point because Google is displaying a Knowledge Panel instead of a traditional local pack. If you see a green Grid Point marked with a 1 and a KP, it means your business is the only one currently being shown by Google at that point!
You can zoom in and out of the Scan Explorer and move around the map with your mouse to focus on specific areas. Clicking on an individual Grid Point will show you a list of all competitors found at that point.
Chatting with Falcon Agent About the Scan Report
Below the Scan Report scores, you'll see a button that says "Chat with Falcon Agent about this scan." Clicking this button launches a chat with the Falcon Agent AI tool, which will automatically start analyzing the report results for you and provide targeted recommendations for improving results.
You can then ask Falcon Agent any follow-up questions you may have in order to help you better interpret the data and chart a course to better visibility.
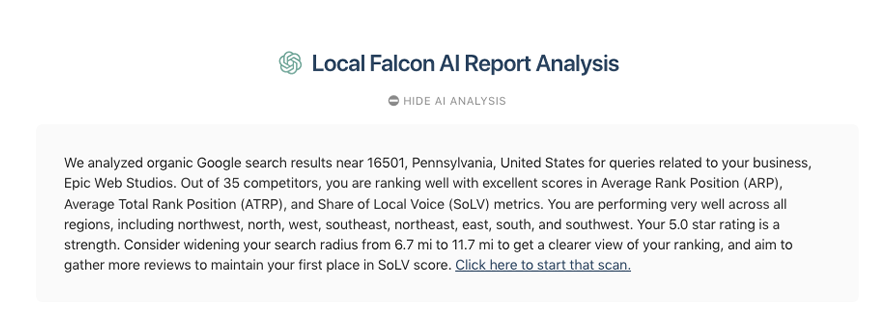
Reading the Local Falcon AI Report Analysis
Below the Scan Explorer, you'll find Local Falcon's AI analysis for the Map Scan, which is made up of an in-depth summary, a checklist of optimization recommendations, citation opportunities, vulnerable competitors, and already-completed listing health-related tasks.
Reviewing the Falcon AI Map Scan Report Summary
A typical Falcon AI Scan Report summary begins with a high-level overview of the scan itself, including the target keyword, grid size, and geographic radius analyzed. From there, Falcon AI explains how your business performed across the entire scanned area, clearly outlining how often you appeared in local results and where visibility is breaking down.
The summary then provides a detailed performance breakdown using Local Falcon's core ranking metrics. Rather than simply stating whether these metrics are "good" or "bad," Falcon AI explains what they mean in context, including how frequently your listing appears, how far down the results you tend to rank, and how your visibility compares to competitors across the grid.
Next, the summary evaluates geographic performance by region (such as north, south, east, west, and surrounding areas). This helps identify whether weak visibility is isolated to certain areas or consistent across the entire market. If performance is poor across multiple regions, Falcon AI explicitly calls this out and explains the implications for local search visibility.
The report then shifts into competitive analysis, highlighting which competitors dominate the local pack, how much Share of Local Voice they control, and why they may be outperforming you. This often includes:
-
Competitors with strong proximity advantages
-
Businesses benefiting from keyword-in-business-name relevance
-
Listings with stronger organic search visibility
-
Profiles with more complete or better-optimized Google Business Profile information
Importantly, Falcon AI doesn't stop at identifying challenges. The summary also highlights competitive opportunities, calling out vulnerable competitors you are well-positioned to overtake. These opportunities are often based on strengths such as:
-
Higher star ratings
-
Significantly more reviews
-
Strong customer sentiment compared to competitors with weaker reputations
Finally, the summary concludes with strategic guidance, explaining how your existing strengths can be leveraged to close ranking gaps and improve visibility. This may include addressing regional weaknesses, improving organic presence, or capitalizing on review and reputation advantages. The report also clarifies that recommendations are generated within the context of the scanned keyword and location, and that broader insights are available when using Campaigns with multiple keywords.
This highly detailed summary format ensures Falcon AI doesn't just report rankings, but also clearly explains why your business is performing the way it is and where the greatest opportunities for improvement exist.
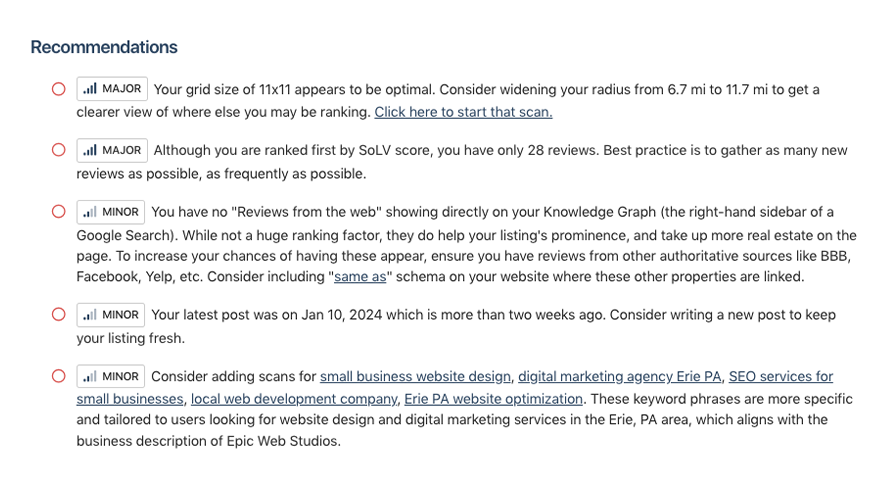
Implementing Falcon AI's Optimization Recommendations
Below the summary, Falcon AI will provide a checklist of optimizations for you to start implementing right away. These are prioritized according to the potential impact they could have on your ranking, so go through them and make any necessary updates to your listing and to your overall local SEO strategy to start checking them off the list.
Checking Relevant Citations
Below Falcon AI's optimization suggestions, you'll see the AI's recommendations for other relevant listing and review sites you may want to list your business on to build citations and boost visibility in organic search results. These can include both general sites, like Yelp, and industry-specific sites, such as SuperLawyers for law firms or Angi.com for home services providers, that rank highly in organic results. Consider adding your business to these directories or updating your citations to increase authority and relevance and drive more traffic.
Identifying Vulnerable Competitors
The Vulnerable Competitors section highlights businesses you are realistically positioned to overtake in local rankings if you implement Falcon AI's recommendations.
Rather than focusing only on top-performing competitors, Falcon AI looks for ranking weaknesses that create opportunity, such as:
-
Low average star ratings
-
Small review counts
-
Reputation gaps compared to your listing
-
Strong visibility driven by factors like proximity or keyword relevance rather than customer trust
For each vulnerable competitor, Falcon AI explains why they are beatable and how your existing strengths — such as higher ratings, significantly more reviews, or stronger customer sentiment— can be leveraged to attract their potential customers.
This section helps you prioritize competitors where improvements like review generation, reputation management, and listing optimization are most likely to result in measurable gains in Share of Local Voice, local pack visibility, and overall competitive positioning on Google Maps.
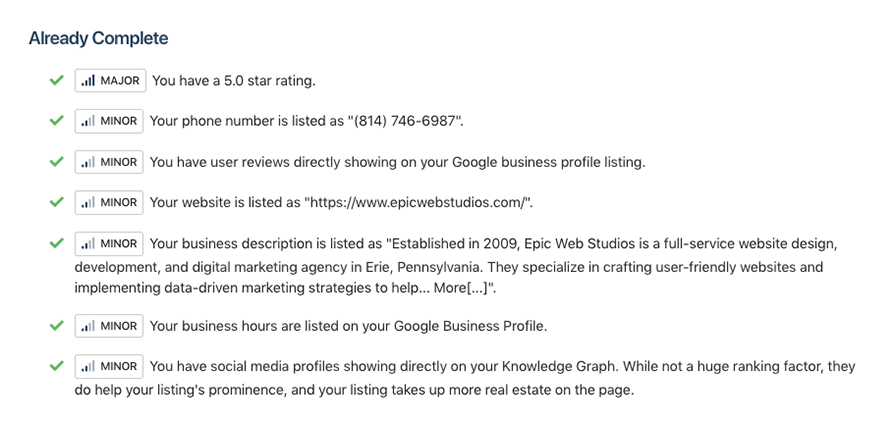
Reviewing Completed Optimizations
Next in Falcon AI's report analysis is another checklist, this time showing what's already completed and healthy for your listing. You don't need to do anything here, but it can give you a good overview of what you've already done to optimize your position.
Category:Reporting
Tags:scan reportreporting